

Monitoring Performance with Dashboard
The Partner Portal’s dynamic dashboards centralize key business metrics, including sales trends, transaction volumes, and partner activities. Partners can customize the display with interactive charts and widgets to track portfolio performance and make real-time, data-driven decisions.
Upon logging into the portal, users are directed to their default dashboard, offering valuable insights for data-driven decision-making.
Watch the interactive walkthrough below to explore portfolio performance.

Types of dashboards
The Partner Portal provides two primary dashboards:
Revenue dashboard – Offers high-level insights into revenue streams and financial performance, accessible only to authorized admin users.
Sales volume dashboard – Available to partners, delivering insights into sales trends, merchant activity, and portfolio growth.
Role-based access determines which dashboards a user can view and interact with, ensuring data security and operational efficiency.
Analyzing sales volume dashboard
The sales volume dashboard provides a detailed view of sales trends, helping users track and optimize portfolio performance. With advanced data visualizations and filtering options, users can assess merchant sales, identify high-performing categories, and detect trends that impact revenue growth.
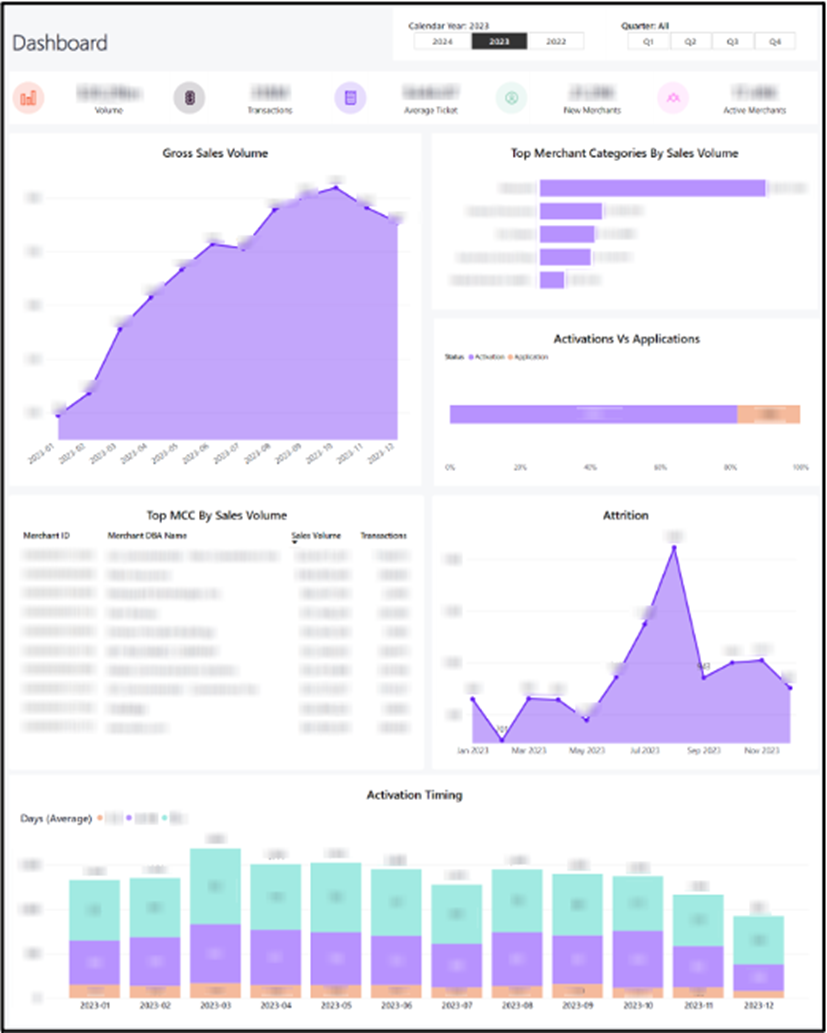
Key metrics and insights
Advanced filters for deeper analysis
The sales volume dashboard offers advanced filtering options that allow users to refine displayed data for deeper insights into sales performance and portfolio trends.
Key capabilities
Custom data selection – Refine data by specific metrics, time periods, or merchant categories to focus on relevant business insights.
Historical data access – View and compare data from the past three years to identify long-term trends and track performance over time.
Interactive insights – Filter transaction data, merchant activity, and sales trends dynamically, ensuring real-time, data-driven decision-making.
Last updated
Was this helpful?